Carrier Table Report
The Carrier Table Report provides a comprehensive directory of every commission schedule and its associated rates currently active in your system. It serves as the primary audit tool to verify that your agency's contracts are accurately reflected in the software.
When to Use This Report
Use this report when you need to:
-
Audit Contract Data - Perform a side-by-side comparison of your carrier contracts against the system's calculation logic.
-
Review Multi-Year Renewals - Verify that commission rates drop or increase correctly as policies move from Year 1 into subsequent renewal terms.
-
Analyze Graded Structures - Ensure that premium "tiers" (e.g., first $5k vs. next $10k) are set up with the correct corresponding percentages.
-
Historical Reference - Keep a printed or digital log of your commission schedules for compliance and internal review.
Generating the Report
This report is designed to give you a total overview of your agency's math logic.
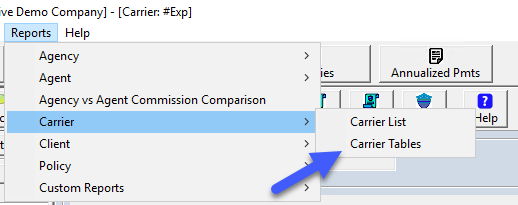
- Navigate to the Reports menu and select Carrier.
- Select Carrier Table Report.
- Note that this report is not subject to external filters (Filter: None) so that it can provide a complete audit of all tables.
Understanding the Report Columns
The report is sorted first by Carrier Name and then alphabetically by Commission Table Name.
| Column | Description |
|---|---|
| Carrier / Commission Table | Displays the Carrier entity and the specific product schedule (e.g., Aetna - Small Group Dental). |
| Comm. Year | Refers to the Policy Term. Year 1 is the initial term; Year 2 and beyond represent renewal cycles. |
| Premium | Represents the premium "tiers" for Graded Tables. It shows the dollar thresholds where rates change. |
| Comm. Rate | The percentage of premium paid to the agency for that specific year and premium tier. |
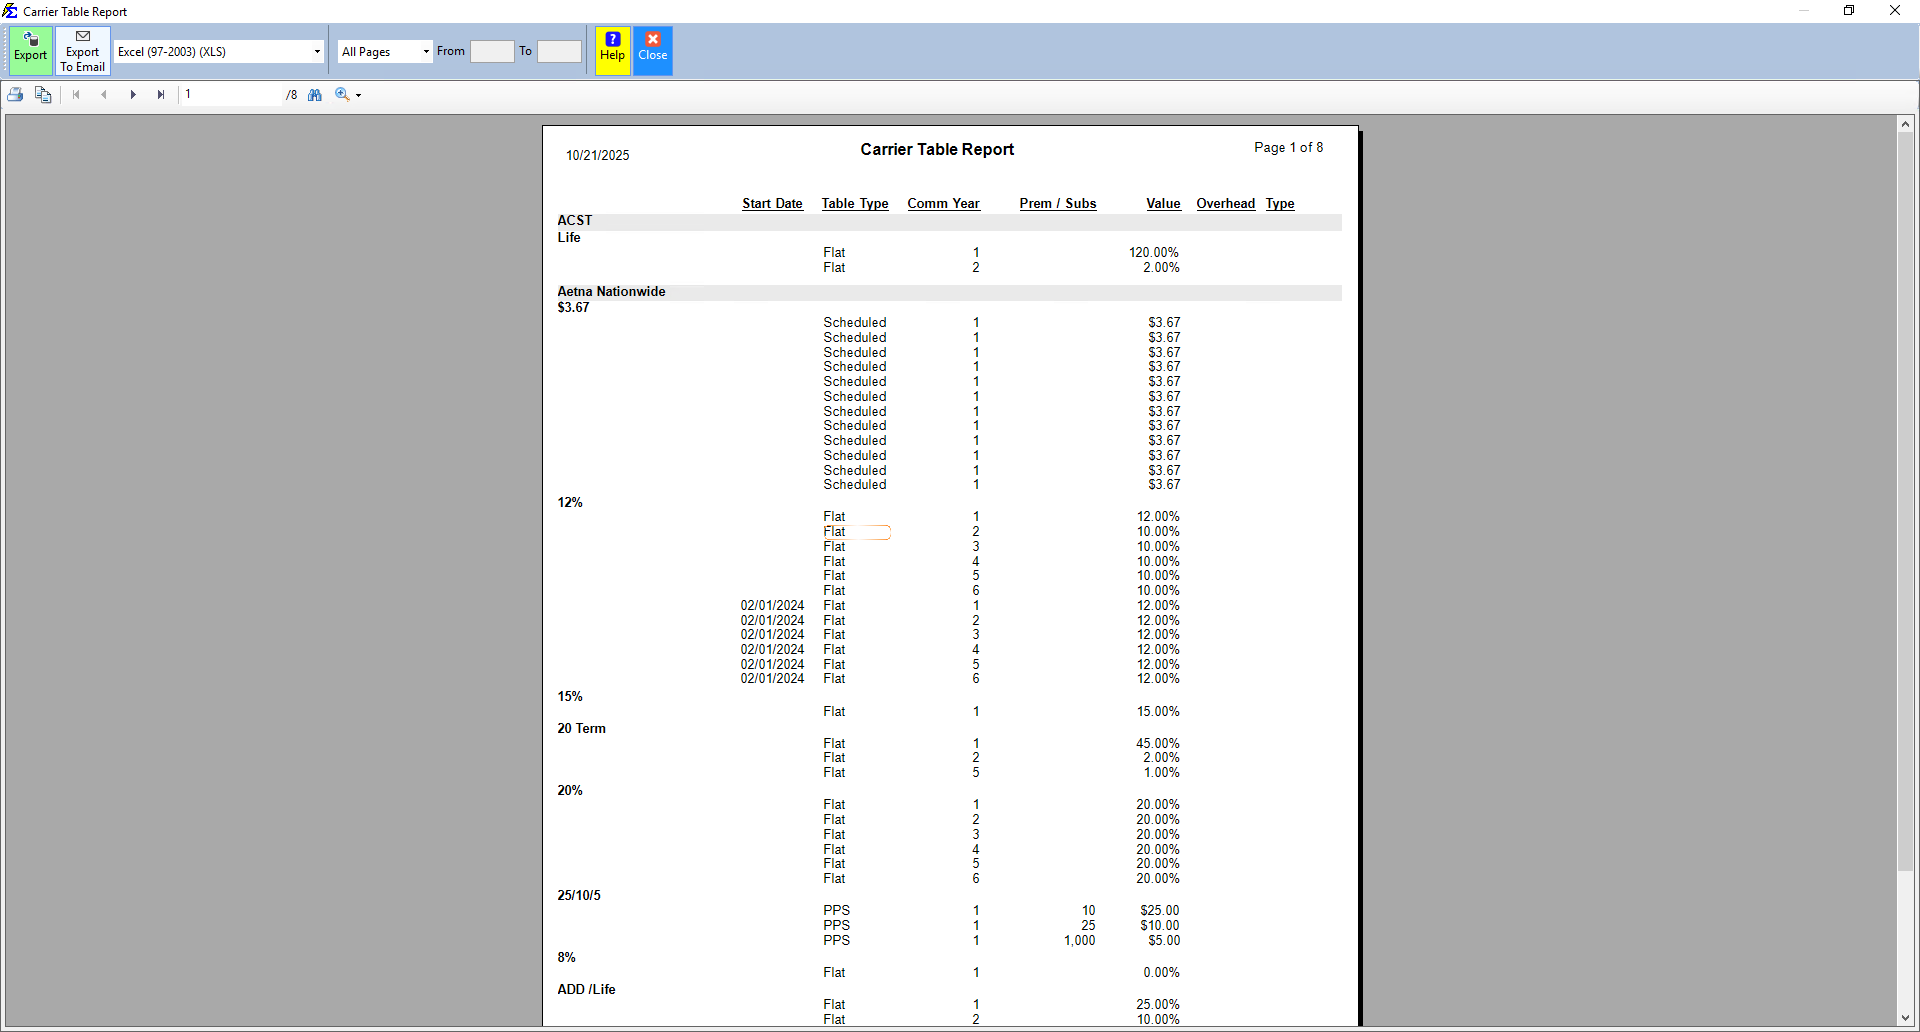
Interpreting Results
The report provides a granular view of how the system handles different commission scenarios:
- Flat Rates: For standard tables, you will see a consistent rate across all premium levels.
- Graded Tiers: For more complex contracts, the report will illustrate the drop in commission as premium thresholds are met (e.g., 20% on the first $1,000, dropping to 15% after $5,000).
- Term Shifts: You can easily spot if a carrier pays a high "Heaped" commission in Year 1 and shifts to a lower "Level" renewal in Year 2.
Troubleshooting
Q: Why do I see multiple entries for the same Carrier Table? A: This usually indicates that the table has multiple Terms or Premium Tiers defined. Each row represents a specific rule the software uses to calculate a payment.
Q: I found an error in a rate on this report. How do I fix it? A: Navigate to the Carrier screen, select the Carrier, and edit the specific Commission Table. Any changes made there will be reflected the next time you run this report.
Next Step: To see how these rates apply to specific policies, visit the Accounts Receivable report.
Need help auditing your rates? Contact support@commission-tracker.com