Commissions by Carrier
The Commissions by Carrier report provides a detailed 12-month financial breakdown of all revenue generated by your carriers. By itemizing payouts into Commission, Bonus, and Override categories, this report offers a clear view of how each carrier contributes to your agency’s bottom line over a calendar year.
When to Use This Report
Use this report when you need to:
-
Track Seasonal Revenue Trends – Identify which months produce the highest volume of commissions across your carrier list.
-
Analyze Revenue Streams – See the exact split between standard commissions, bonuses, and overrides for every policy.
-
Carrier Performance Reviews – Evaluate which carriers are your top producers based on total annual revenue.
-
Annual Planning – Compare year-over-year carrier growth to make informed decisions for the upcoming fiscal year.
Generating the Report
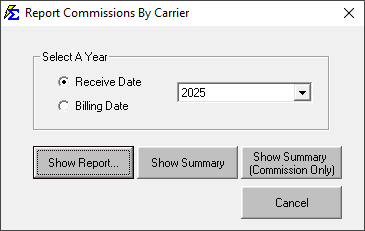
This report utilizes a calendar year filter to provide a complete 12-month scope.
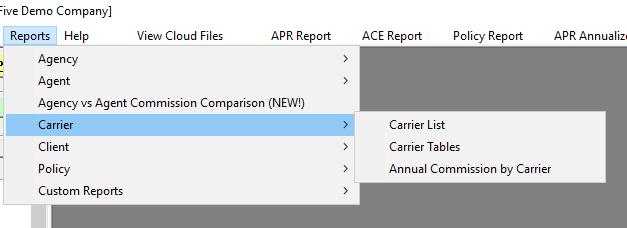
- Navigate to the Reports menu and select Carrier.
- Select Commissions by Carrier.
- Use the Year filter to select the 12-month period you wish to analyze.
Understanding the Report Layout
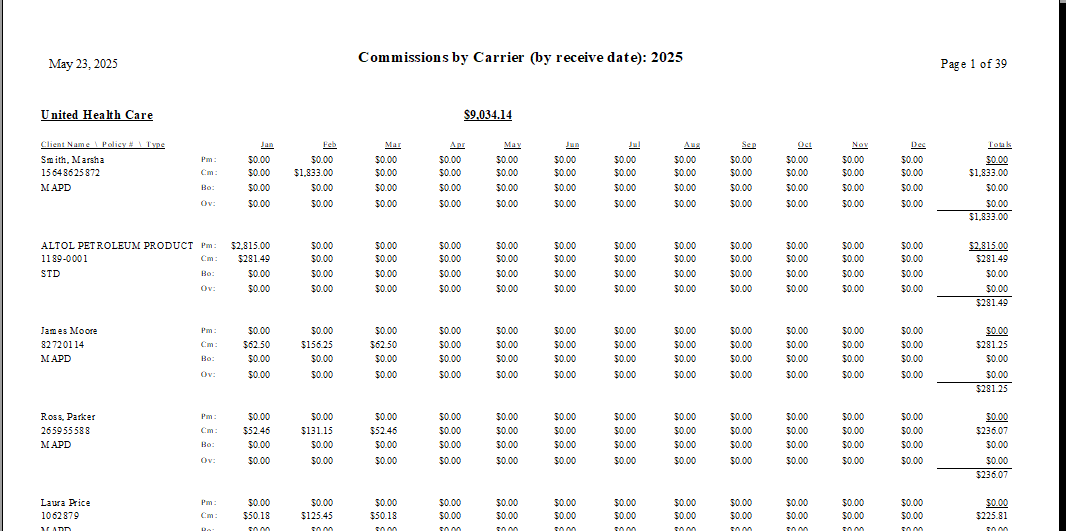
The report is sorted by Total Revenue in descending order, placing your most profitable carriers at the top.
| Section | Description |
|---|---|
| Client Name / Policy # / Type | Identifies the client, their specific policy number, and the line of business (e.g., Health, Dental). |
| Jan - Dec Columns | Itemizes the revenue received each month. Each month is split into three rows: Commission, Bonus, and Override. |
| Totals Column | Displays the annual sum of each revenue category for that specific policy. |
| Summary Row | Provides the grand total of all three revenue types combined. |
Interacting with the Results
The report provides a granular view of every dollar received, allowing you to audit specific carrier behaviors.
- Revenue Itemization: Unlike a simple summary, this report breaks down "Override" and "Bonus" payments separately, which is essential for verifying extra-contractual carrier payments.
- Monthly Flux: You can easily spot missed payments or months where a carrier significantly increased their payouts due to enrollment spikes.
Troubleshooting
Q: Why is a specific carrier missing from my report? A: The report only includes carriers that generated revenue within the selected 12-month scope. If no payments were posted for that carrier in the selected year, they will not appear.
Q: Does this report show what I paid my agents? A: No. This report is focused strictly on the revenue paid to the agency. To see agent-specific payouts, please refer to the Agent Commission Earned.
Next Step: To analyze revenue grouped by product type rather than carrier name, visit the Commissions by Carrier Table report.
Need help with your carrier data? Contact support@commission-tracker.com